
Advertisement
Advertisement
Natural Gas and Oil Forecast: OPEC+ Output Plan Pressures Oil Rally Near 2-Month Highs
By:
Key Points:
- WTI crude hits $65.40, a 2-month high, amid U.S.–China trade optimism and rising geopolitical tensions.
- Saudi Arabia’s OPEC+ proposal to add 411K bpd in August could cap oil’s bullish momentum through late 2025.
- Natural gas stabilizes above $3.60 support, with bulls eyeing a breakout above $3.686 to confirm momentum.

Market Overview
WTI crude oil futures edged up to $ 65.40 per barrel on Tuesday, marking a two-month high amid intensifying geopolitical tensions and cautious optimism surrounding U.S.–China trade talks.
Investors are closely watching as negotiations continue, with early feedback suggesting potential progress that could mitigate demand risks tied to tariffs.
Meanwhile, regional instability and stalled diplomatic efforts elsewhere are contributing to elevated energy prices. However, upside momentum is tempered by Saudi Arabia’s proposal to raise OPEC+ output by 411,000 barrels per day in August, with a possible follow-up in September, rekindling concerns of oversupply in the second half of 2025.
Natural Gas Price Forecast
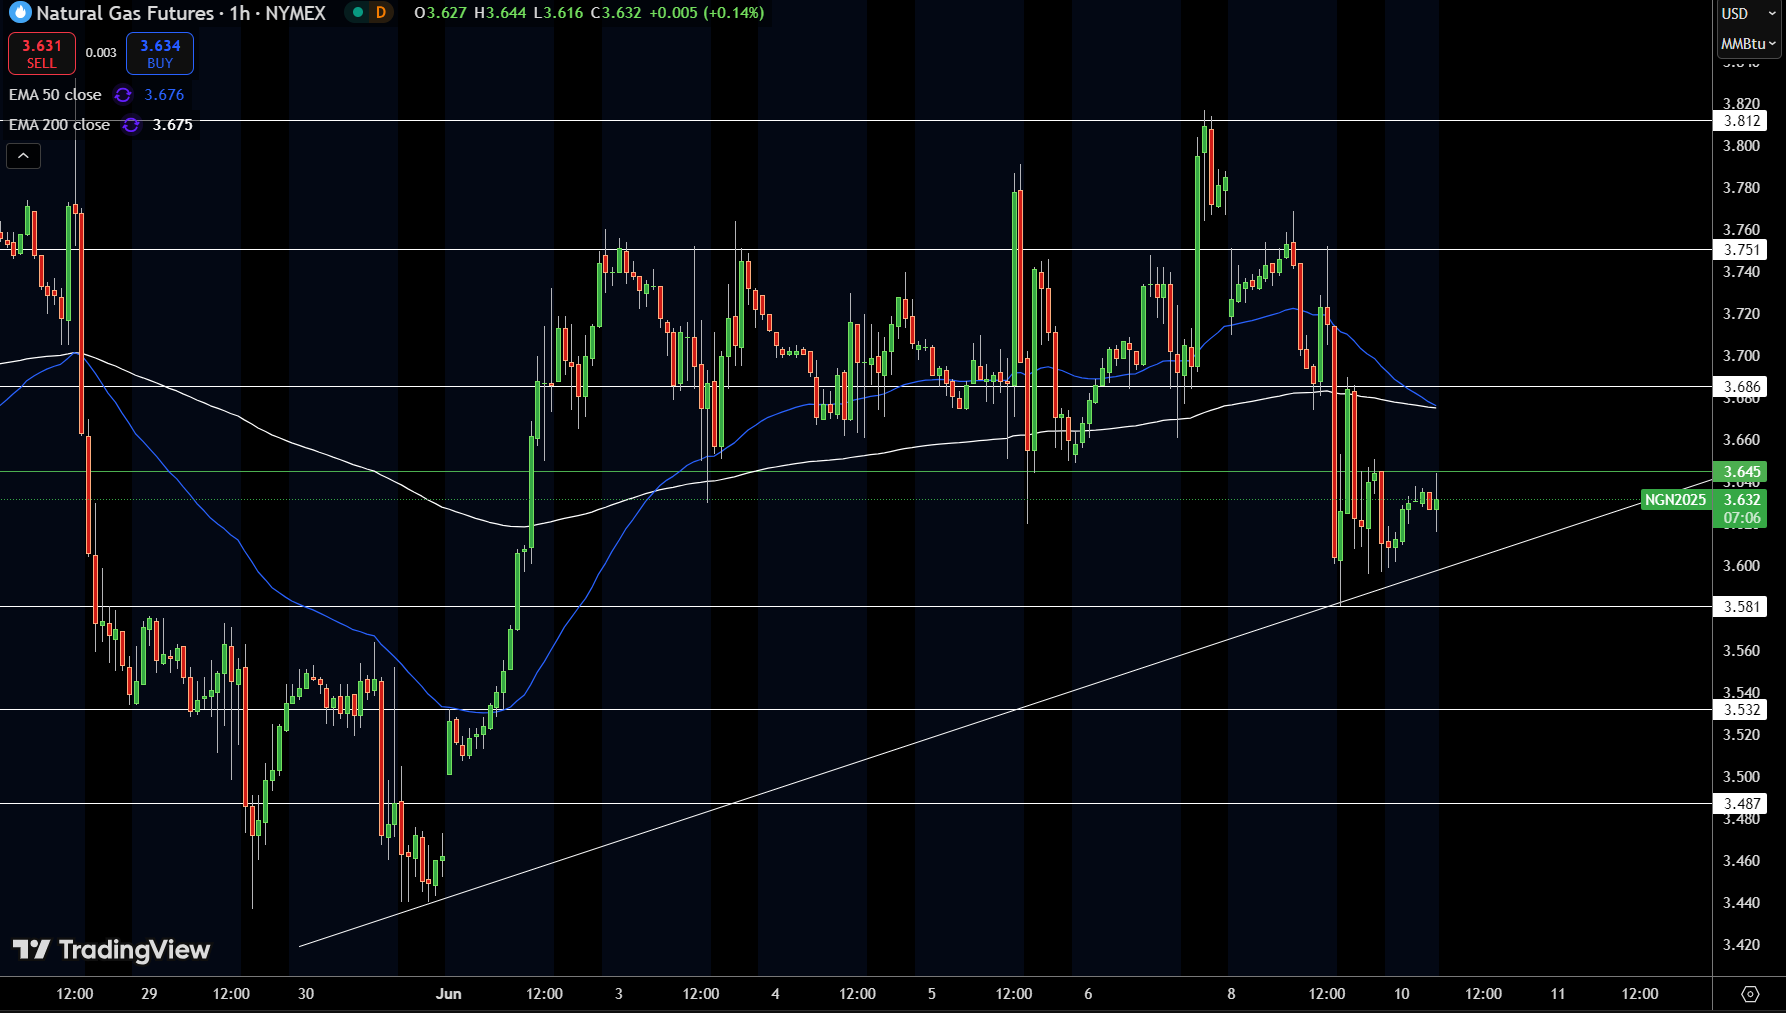
Natural Gas (NGN2025) is trading at $3.63, consolidating just above trendline support drawn from the May 30 low. The price briefly dipped near the $3.60 mark before stabilizing, as buyers returned near the 200-EMA at $3.675.
A bounce from this area remains possible, but the 50-EMA is sloping downward, indicating short-term pressure. Resistance lies at $3.686, and only a clean break above this level would signal renewed bullish momentum.
If price fails to hold above $3.60, the next support is seen at $3.581. The rising trendline still provides structure, but near-term momentum is neutral until bulls reclaim the short-term moving averages with conviction.
WTI Oil Price Forecast
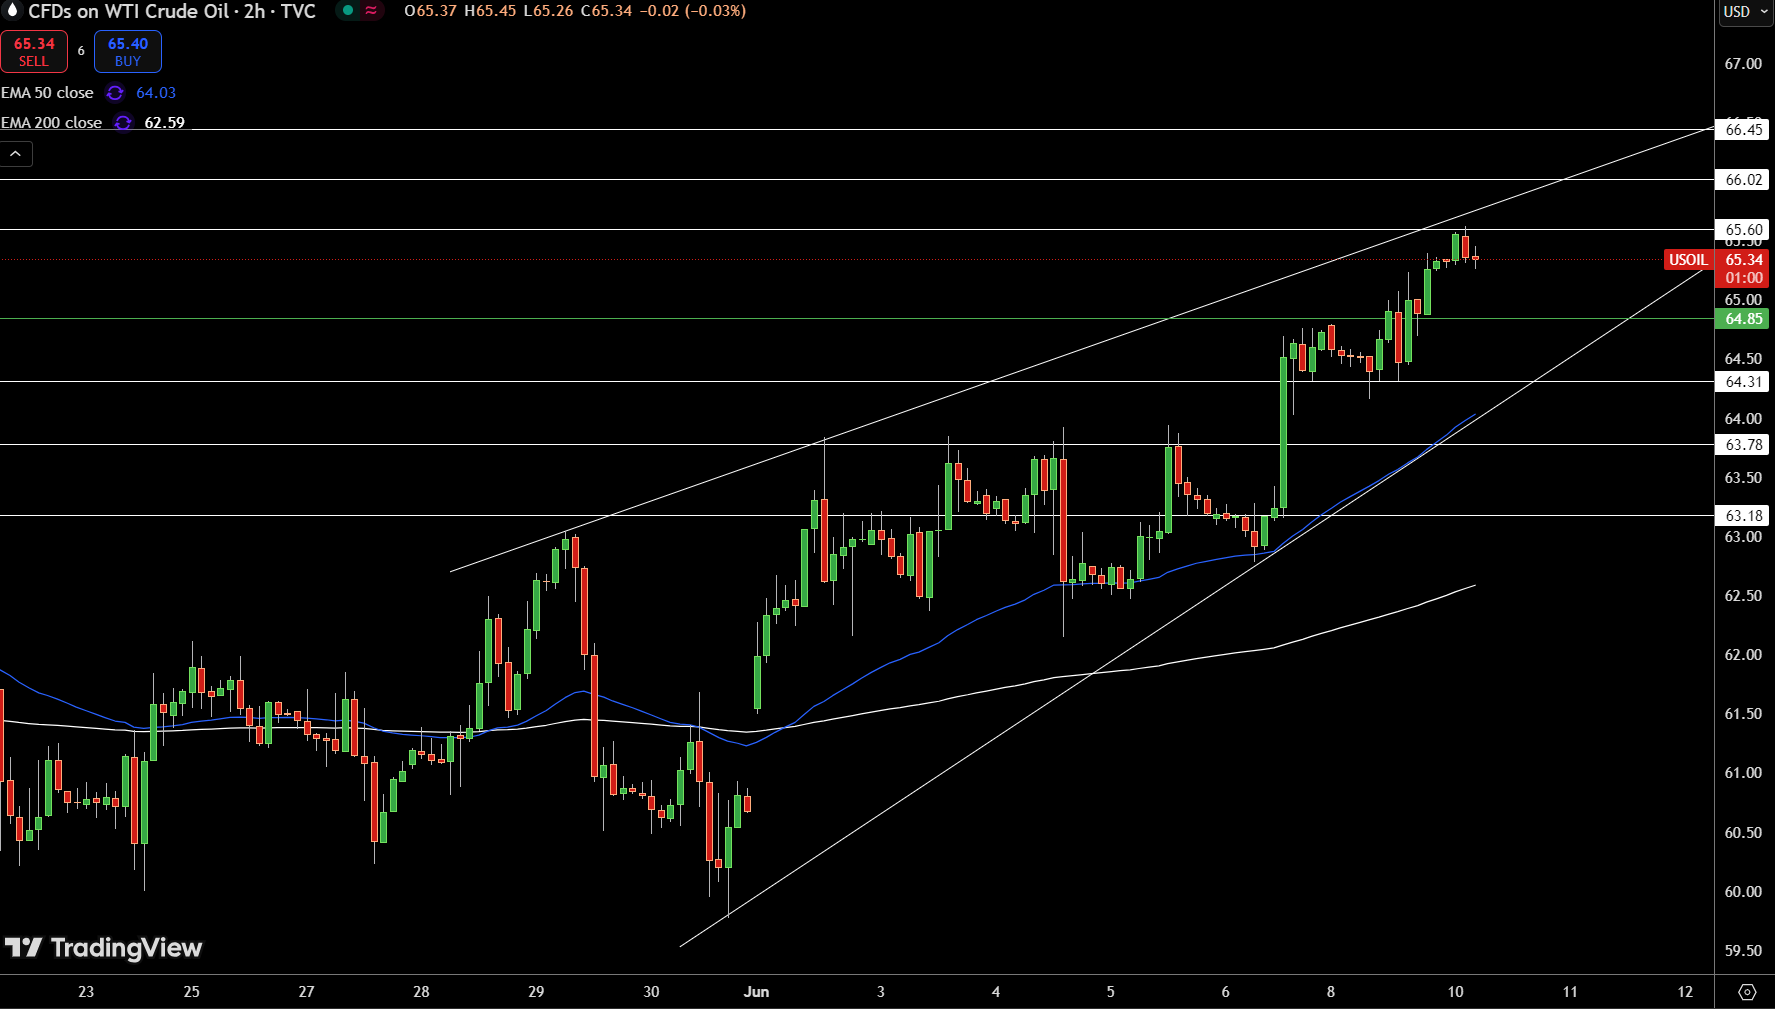
WTI Crude Oil is trading at $65.34, showing signs of hesitation near the upper boundary of a rising wedge pattern. Price recently cleared the $64.85 level and is now consolidating just below $65.60, a minor resistance area.
The 50-EMA at $64.03 continues to provide dynamic support, while the 200-EMA remains well below current price action, confirming a short-term bullish bias. The rising wedge, however, could pose a risk of a reversal if price closes below the lower boundary near $64.85.
If momentum picks up above $65.60, the next resistance level is seen at $66.02, followed by $66.45. For now, the structure remains intact, but attention is warranted as the wedge begins to narrow.
Brent Oil Price Forecast
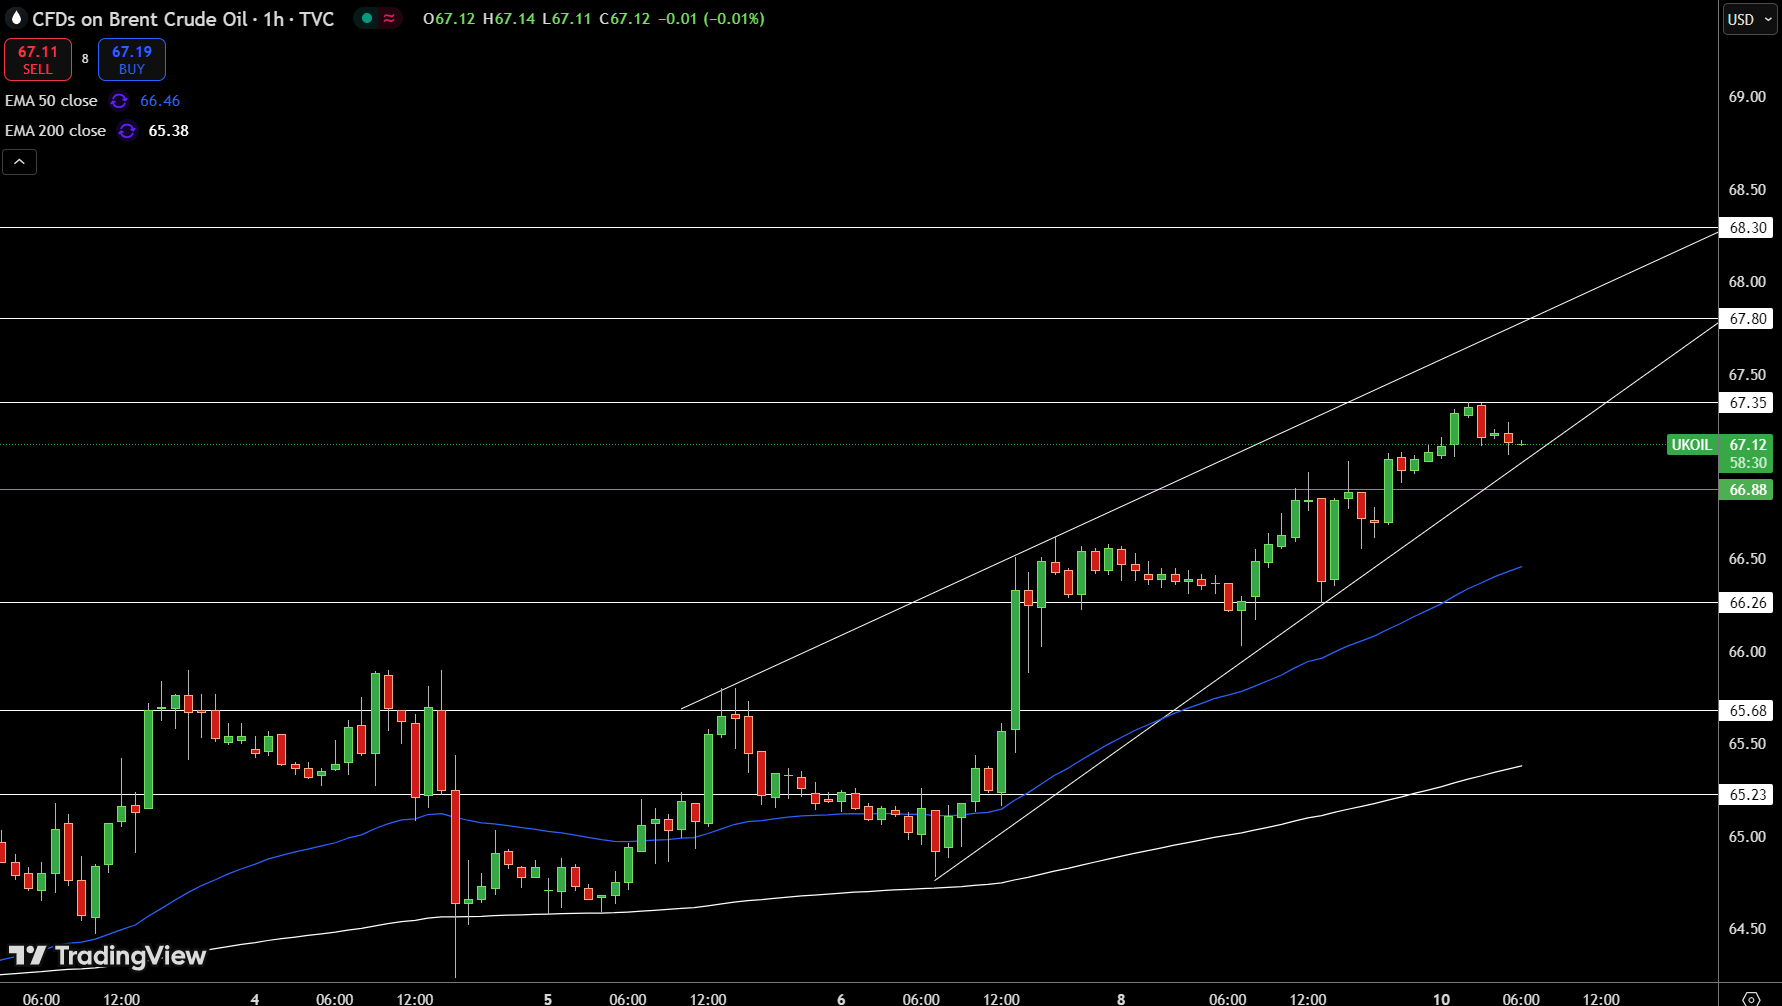
Brent Crude Oil (UKOIL) is trading near $67.12, holding within a rising channel on the 1-hour chart. Price recently tested resistance at $67.35, but momentum has cooled slightly as candles consolidate near the channel midline.
The 50-EMA at $66.46 offers dynamic support, while the 200-EMA at $65.38 anchors the broader uptrend. A breakdown below $66.88—the nearest horizontal support—could trigger a retest of $66.26. On the upside, a clean break above $67.35 could open the door toward $67.80 and $68.30.
About the Author
Bob MasonChief Crypto Boss
123456789 30 He has written extensively for a broader audience and his current focus is on developments relating to the financial markets including, but not limited to currencies, commodities, alternative asset classes, and global equities.


Advertisement