
Advertisement
Advertisement
US Dollar Price Forecast: Struggles After Industrial Output Drops – GBP/USD and EUR/USD
By:
Key Points:
- US Dollar Index slips to 98.58 as retail sales plunge 0.9% and industrial production drops for a second time in three months.
- Traders now price in 80% odds of a Fed rate cut in September, with a second likely in October amid weak economic data.
- DXY rejected from 98.87 resistance, with technical structure favoring bears below the 200-EMA and descending trendline.

Market Overview
The U.S. Dollar Index (DXY) edged lower during early Asian trading on Wednesday, hovering near 98.58. The decline follows a batch of disappointing economic data and increased speculation that the Federal Reserve may hold rates steady at its upcoming June meeting.
Tuesday’s data revealed a sharper-than-expected 0.9% drop in May retail sales, well below the 0.7% forecast and a significant decline from April’s -0.1% print. Industrial production also contracted by 0.2%, reversing April’s modest gain. These indicators suggest softening consumer and manufacturing activity, reinforcing the market’s dovish lean.
According to Reuters, traders now assign an 80% probability of a rate cut in September, with growing expectations for a second cut in October.
Middle East Tensions Offer Temporary Support
While domestic data pressures the greenback, geopolitical uncertainty in the Middle East is providing some safe-haven support. Iran has reportedly approached Gulf states, including Oman and Qatar, to mediate tensions and encourage the U.S. toward a ceasefire.
Former President Trump’s social media statement demanding Iran’s “unconditional surrender” has added to fears of broader U.S. involvement. Amid this uncertainty, the dollar remains underpinned in the short term as investors seek safety in volatile markets.
US Dollar Index (DXY) – Technical Analysis
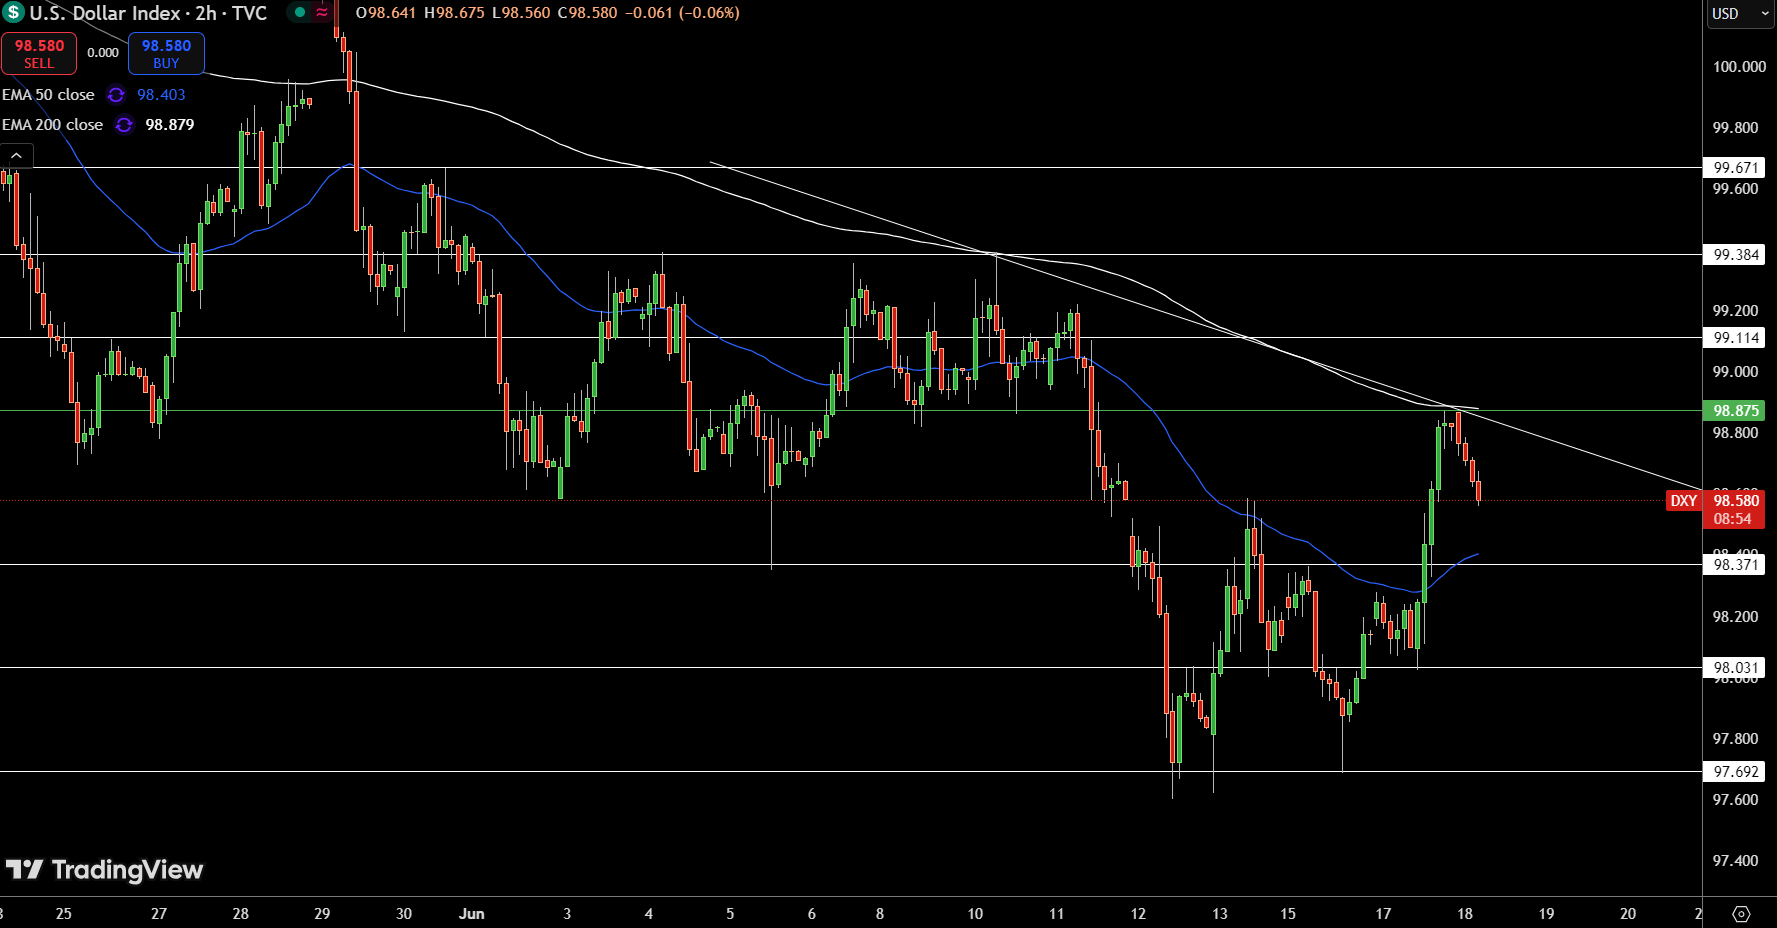
The U.S. Dollar Index (DXY) is trading near 98.58 after failing to sustain above the key 98.87 resistance level, which aligns with both the 200-period EMA and descending trendline resistance on the 2-hour chart. This rejection suggests fading bullish momentum after a sharp recovery from the 98.03 support zone.
Price is now hovering just above the 50-period EMA at 98.40, which could act as interim support. A break below this zone risks a retest of 98.03 and potentially the 97.69 support area. On the upside, a decisive close above 98.87 would be needed to invalidate the bearish trend and open the path toward 99.11 and 99.38.
The broader structure still favors sellers below the descending trendline, with the 200-EMA continuing to act as a ceiling. Traders should watch for volume confirmation near 98.40–98.87 to gauge the next directional move.
GBP/USD Technical Analysis

The GBP/USD pair is attempting a recovery, trading near $1.3463 after rebounding from the $1.3414 low. The pair fell sharply earlier, breaching the 200-EMA ($1.3510) and slicing through multiple Fibonacci retracement levels. Price is now testing the 23.6% Fib level at $1.3452, with potential resistance at $1.3475 (38.2%) and $1.3494 (50%).
A continued move higher would face additional hurdles at $1.3513 (61.8%) and $1.3539 (78.6%), where both EMAs converge. Failure to clear these levels may resume bearish momentum, exposing support at $1.3414 and $1.3389.
The recovery appears corrective unless bulls reclaim $1.3539 with conviction. Watch for rejection candles or bullish volume spikes to confirm the next directional move.
EUR/USD Technical Forecast
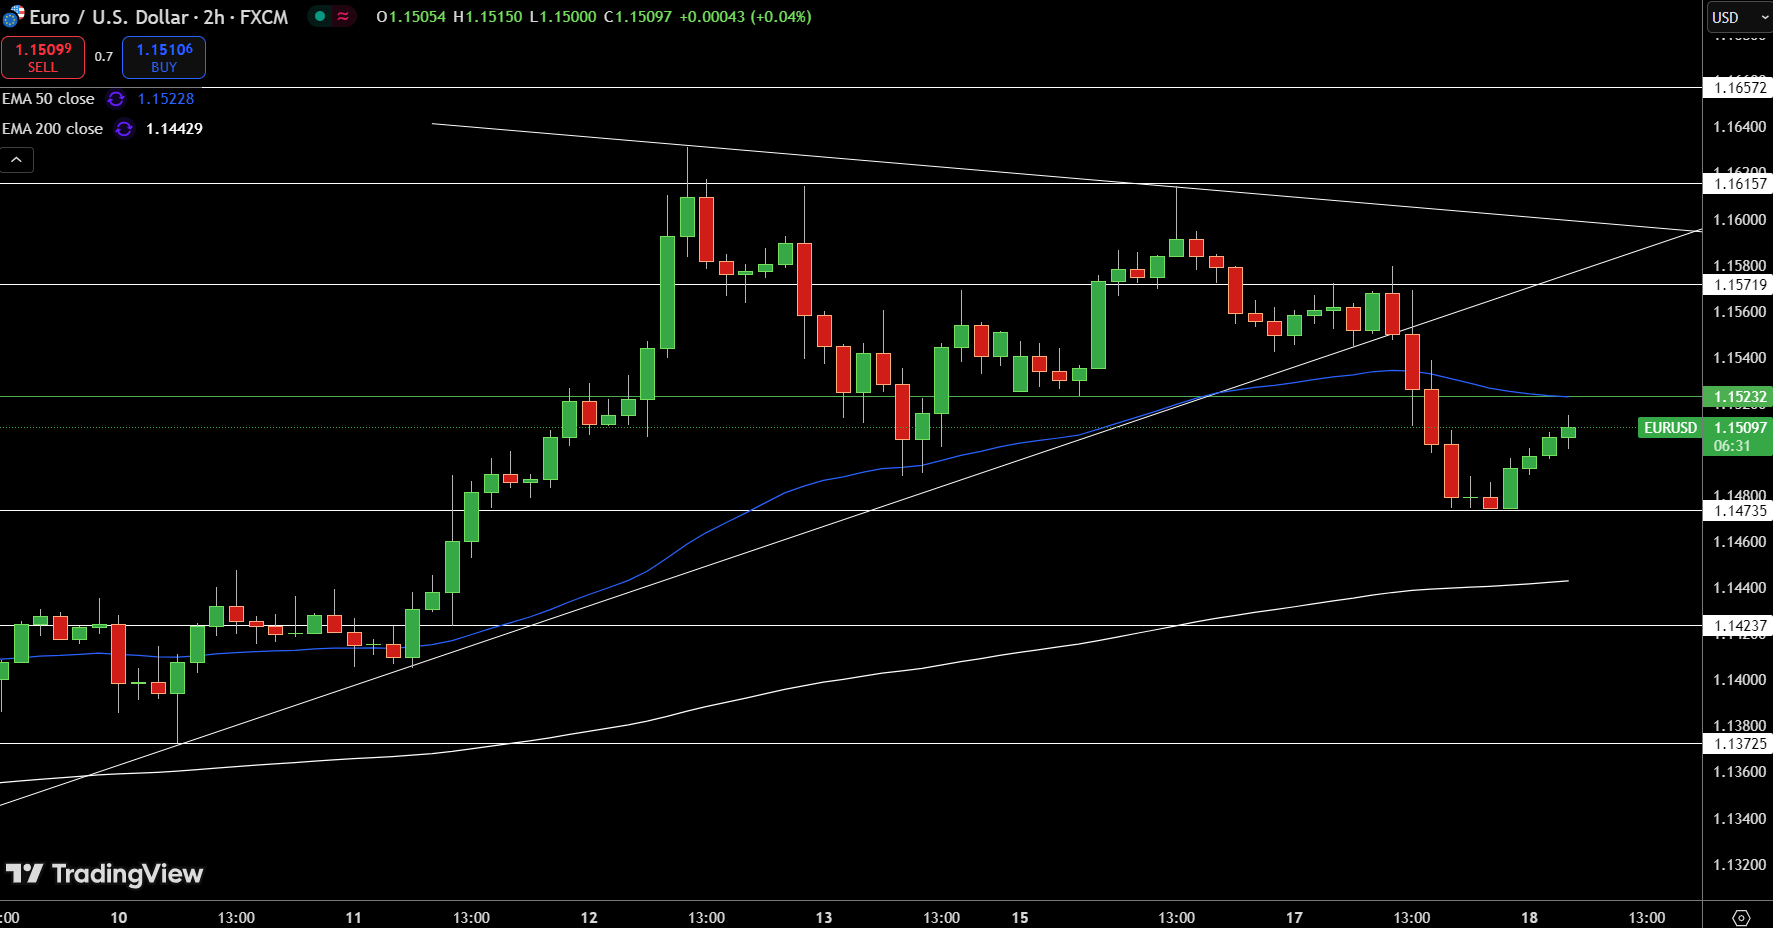
The EUR/USD pair is trading near $1.1509 after slipping below key support at the $1.1523 50-EMA and an ascending trendline, confirming near-term bearish momentum. The brief rebound from $1.1473 lacks strength, with upside limited unless price clears the former support-turned-resistance.
A sustained move above $1.1523 could open the path toward $1.1571, while failure to reclaim this zone risks renewed selling toward $1.1442 and $1.1423, aligning with the 200-EMA. The broader structure remains trapped between $1.1372 and $1.1615, suggesting a lack of clear trend.
About the Author
Bob MasonChief Crypto Boss
123456789 30 He has written extensively for a broader audience and his current focus is on developments relating to the financial markets including, but not limited to currencies, commodities, alternative asset classes, and global equities.


Advertisement