
Advertisement
Advertisement
Natural Gas Price Forecast: Tests Key Support Near $3.50
By:
Despite a bearish session, natural gas could stabilize around key support near $3.50, backed by converging moving averages and volume-weighted indicators.
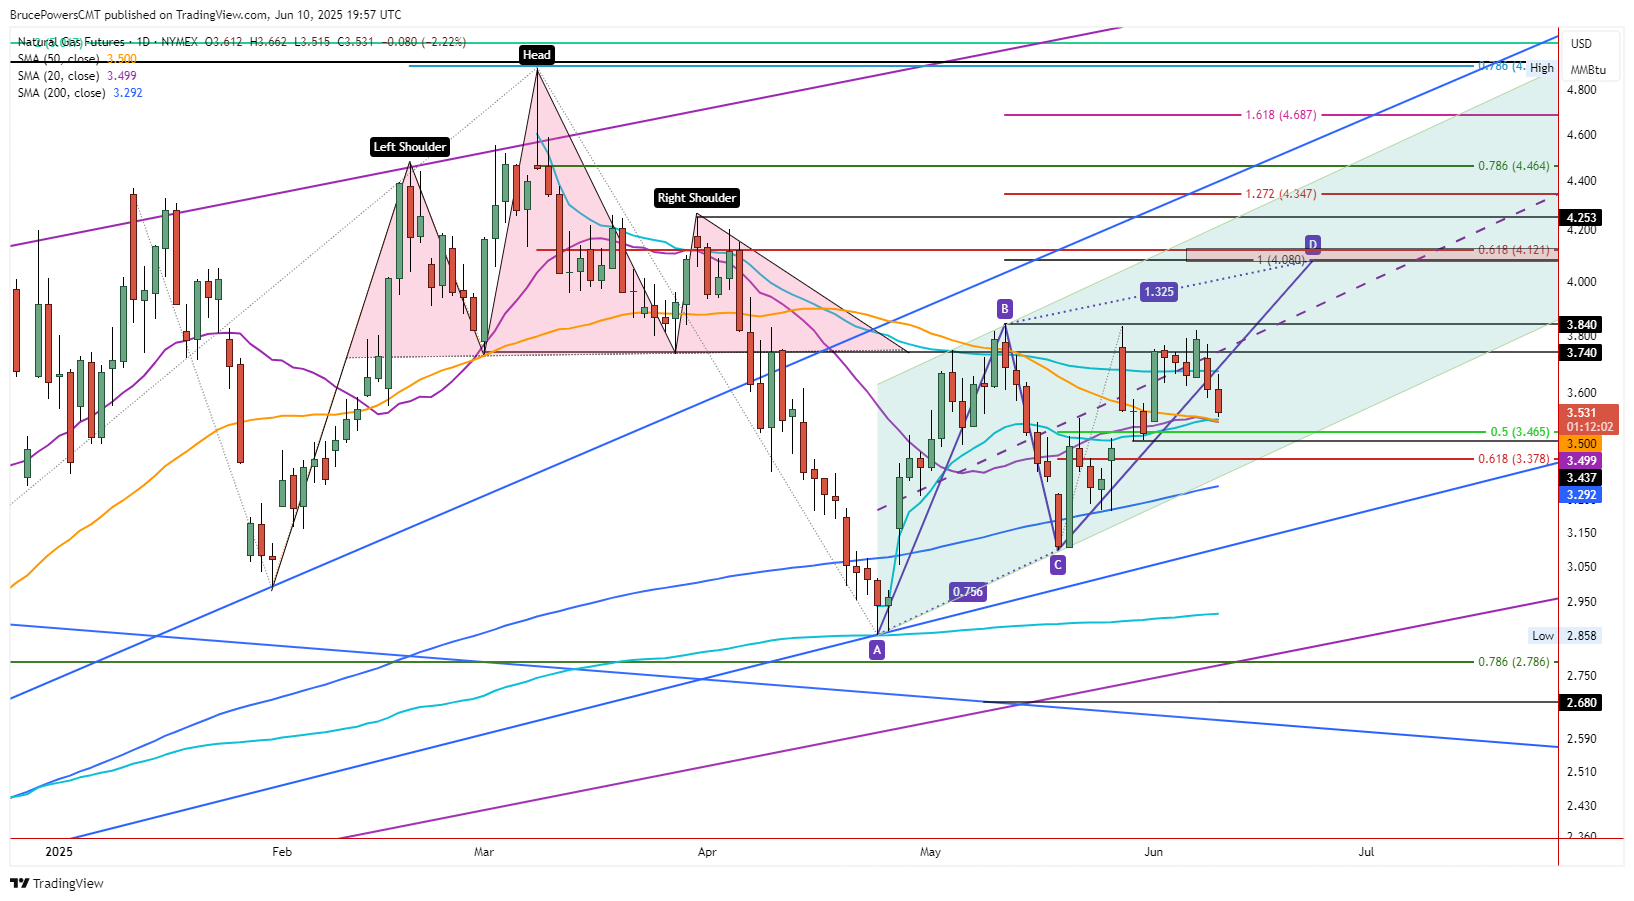
Natural gas continued to pullback towards the 50-Day MA, now at $3.50, on Tuesday, reaching a low of $3.52 for the day. Downward pressure remains however, as a new lower daily high and low was established and it looks like a bearish closing price will end the day’s session as well. Trading continues near the lows of the day at the time of this writing, and it is set to close in a relatively weak position, in the lower third of the day’s trading range.
Strong Support Possible at $3.50 Plus
Potential support around the 50-Day MA takes on added significance since it is joined by two other indicators. The 20-Day MA converged with the 50-Day line recently and an anchored volume weighted average price (AVWAP) level is at $3.51 currently. Having said that, last week’s low was $3.50. Since it is a weekly support level, it takes on added significance relative to a daily level. This means two things. Either weekly support is broken to the downside, pointing to still lower prices, or strong support is found at or above the weekly low, that leads to a bullish reversal.
Breakdown Points to $3.44
A little lower is key support at $3.44, as it is a higher swing low and therefore part of the price structure for the near-term rising trend that began from the May swing low (C). A drop below it would indicate a potential bearish reversal following two recent lower swing highs, relative to the May swing high (B). If the $3.44 swing low is broken to the downside, then the next lower price levels to watch for support, include the 61.8% Fibonacci retracement at $3.38 and the 200-Day MA, now at $3.29. There were two recent successful tests of support around the 200-Day MA during bearish corrections.
200-Day MA at $3.29
Therefore, a drop to the 200-Day line might be the lowest price level reached if the current pullback continues to weaken. Having said that, given the strengthening relationship with the 200-Day MA, support would more likely be seen a little above the 200-Day line, if not more so. Notice that the decline in April dropped below the 200-Day MA for four days before recovering. In May, the dip below the 200-Day line occurred over two days. Further, the drop below the line in April was greater than what occurred in May.
For a look at all of today’s economic events, check out our economic calendar.
About the Author
Bruce Powerscontributor
Bruce has been involved in the financial markets for over 20 years, as an analyst, trader, educator, and writer.


Advertisement